Build Mapping Tools in Minutes with AI
Build Mapping Tools in minutes. Use Lovable to create interactive maps and location-based tools for any purpose.
Define your mapping tool's features and goals.
Lovable generates an interactive map platform instantly.
Customize layers, data points, and visualizations.
Launch your tool and start exploring locations.
A superhuman full stack product engineer.
Instant & intuitive
Live rendering, handles image input, has instant undo and lets you collaborate with branching. The AI fixes your bugs. One-click deploy when ready.
Beautiful design
We believe your product should look good. Lovable follows best practice UI & UX principles to make sure every idea you bring to life is beautifully designed.
Support any backend
Lovable has support for databases, API integrations and back-end functionality. Connect your own or use our Supabase connector.
Select & edit
The accuracy you need to make fine grained changes. With Select & Edit you click an element and describe what you want updated.
Github integration
Connect Lovable to your GitHub account to automatically sync the code to your repository. Perfect for project hand offs and more advanced workflows.

Loved by thousands of product creators
"I absolutely LOVE your product! It is the single best thing that I experienced since I found ChatGPT! The value that you create with this is just over the top mind-blowing as it basically replaces or enhances a ton of SaaS-Solutions in an instant."
Thomas
"Lovable is hands down the best tool I've ever used. It's like a super senior dev who shares his tricks with you. For the first time, I can build apps without the headache. It's so much fun to use and gets me results in a heartbeat. Love it!"
Karin
"I'm always amazed at how fast we can whip up a UI with Lovable. It gives me a solid base that I can easily tweak and build on. Plus, using it to integrate it with the backend is magical!"
Martin - Platanus
Frequently asked questions
Free users can start public projects, and have a limited number of AI credits. Paid users can create private projects and have more AI credits.
Simply sign up and start chatting with Lovable about what you want to build."
Most projects can be built in minutes to hours, depending on complexity.
Lovable is an AI software engineer, which enables anyone to build for the web. Simply chat to instantly build websites and web apps, with no technical knowledge needed.
Credits are units Lovable uses to measure and pay for usage across your workspace. Credits let you build apps, run deployed apps, and power AI features from one balance. The value of a credit and the rate at which they are consumed for a given action depend on your subscription plan and the feature used, and credits are not necessarily equal in value across different plans.
Paid plans have access to a credit balance. Credits from your balance can be used in Lovable for building by sending messages to Lovable, hosting with Cloud, and offering AI features to users as part of your app.
In addition to your credit balance, Pro and Business subscriptions include grants for building and hosting with Cloud.
For building, pricing varies by mode:
Default Mode: credits vary based on task complexity
Plan Mode: 1 credit per message
Here are some example prompts and their cost:
| User Prompt | Work Done | Credits |
|---|---|---|
| “Make the button gray” | Updates the button styles | 0.50 |
| “Remove the footer” | Removes the footer component | 0.90 |
| “Add authentication with sign up and login” | Adds authentication pages and logic, updates routes | 1.20 |
| “Build me a landing page, use images” | Creates a landing page with 3 generated images, theme, and 5 sections | 1.70 |
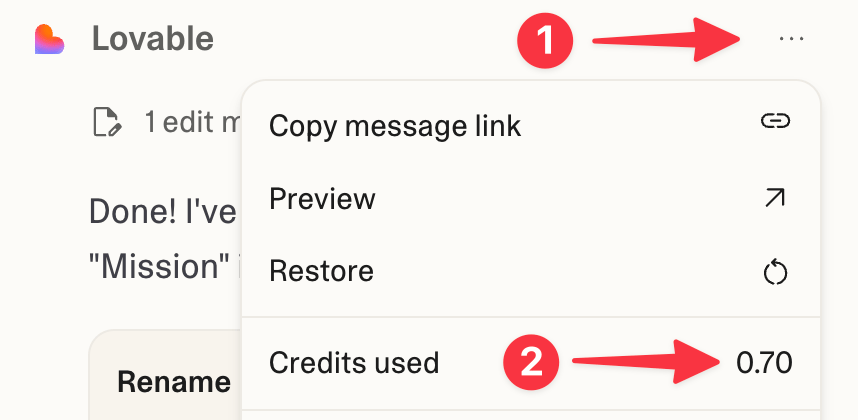
You can see the cost of each message in the message history by hovering over the three dots of an message.
Related articles
Idea to Mapping Tools in Seconds:
Lovable makes creating mapping tools simple, helping businesses visualize and analyze location data effectively.